system.processes Introspection
The Processes Introspection tool provides real-time visibility into all currently running queries on your ClickHouse cluster. It displays a comprehensive table of active processes with detailed information about each query, and allows you to kill problematic queries directly from the UI.
Prerequisites
Note: Read access to the
system.processestable and permission to executeKILL QUERYcommands are required to use this introspection tool. Ensure your user has the necessary system table privileges.
UI
The Processes Introspection tool displays a single table showing all active queries from system.processes. Each row represents a currently running query with detailed information about its execution state.
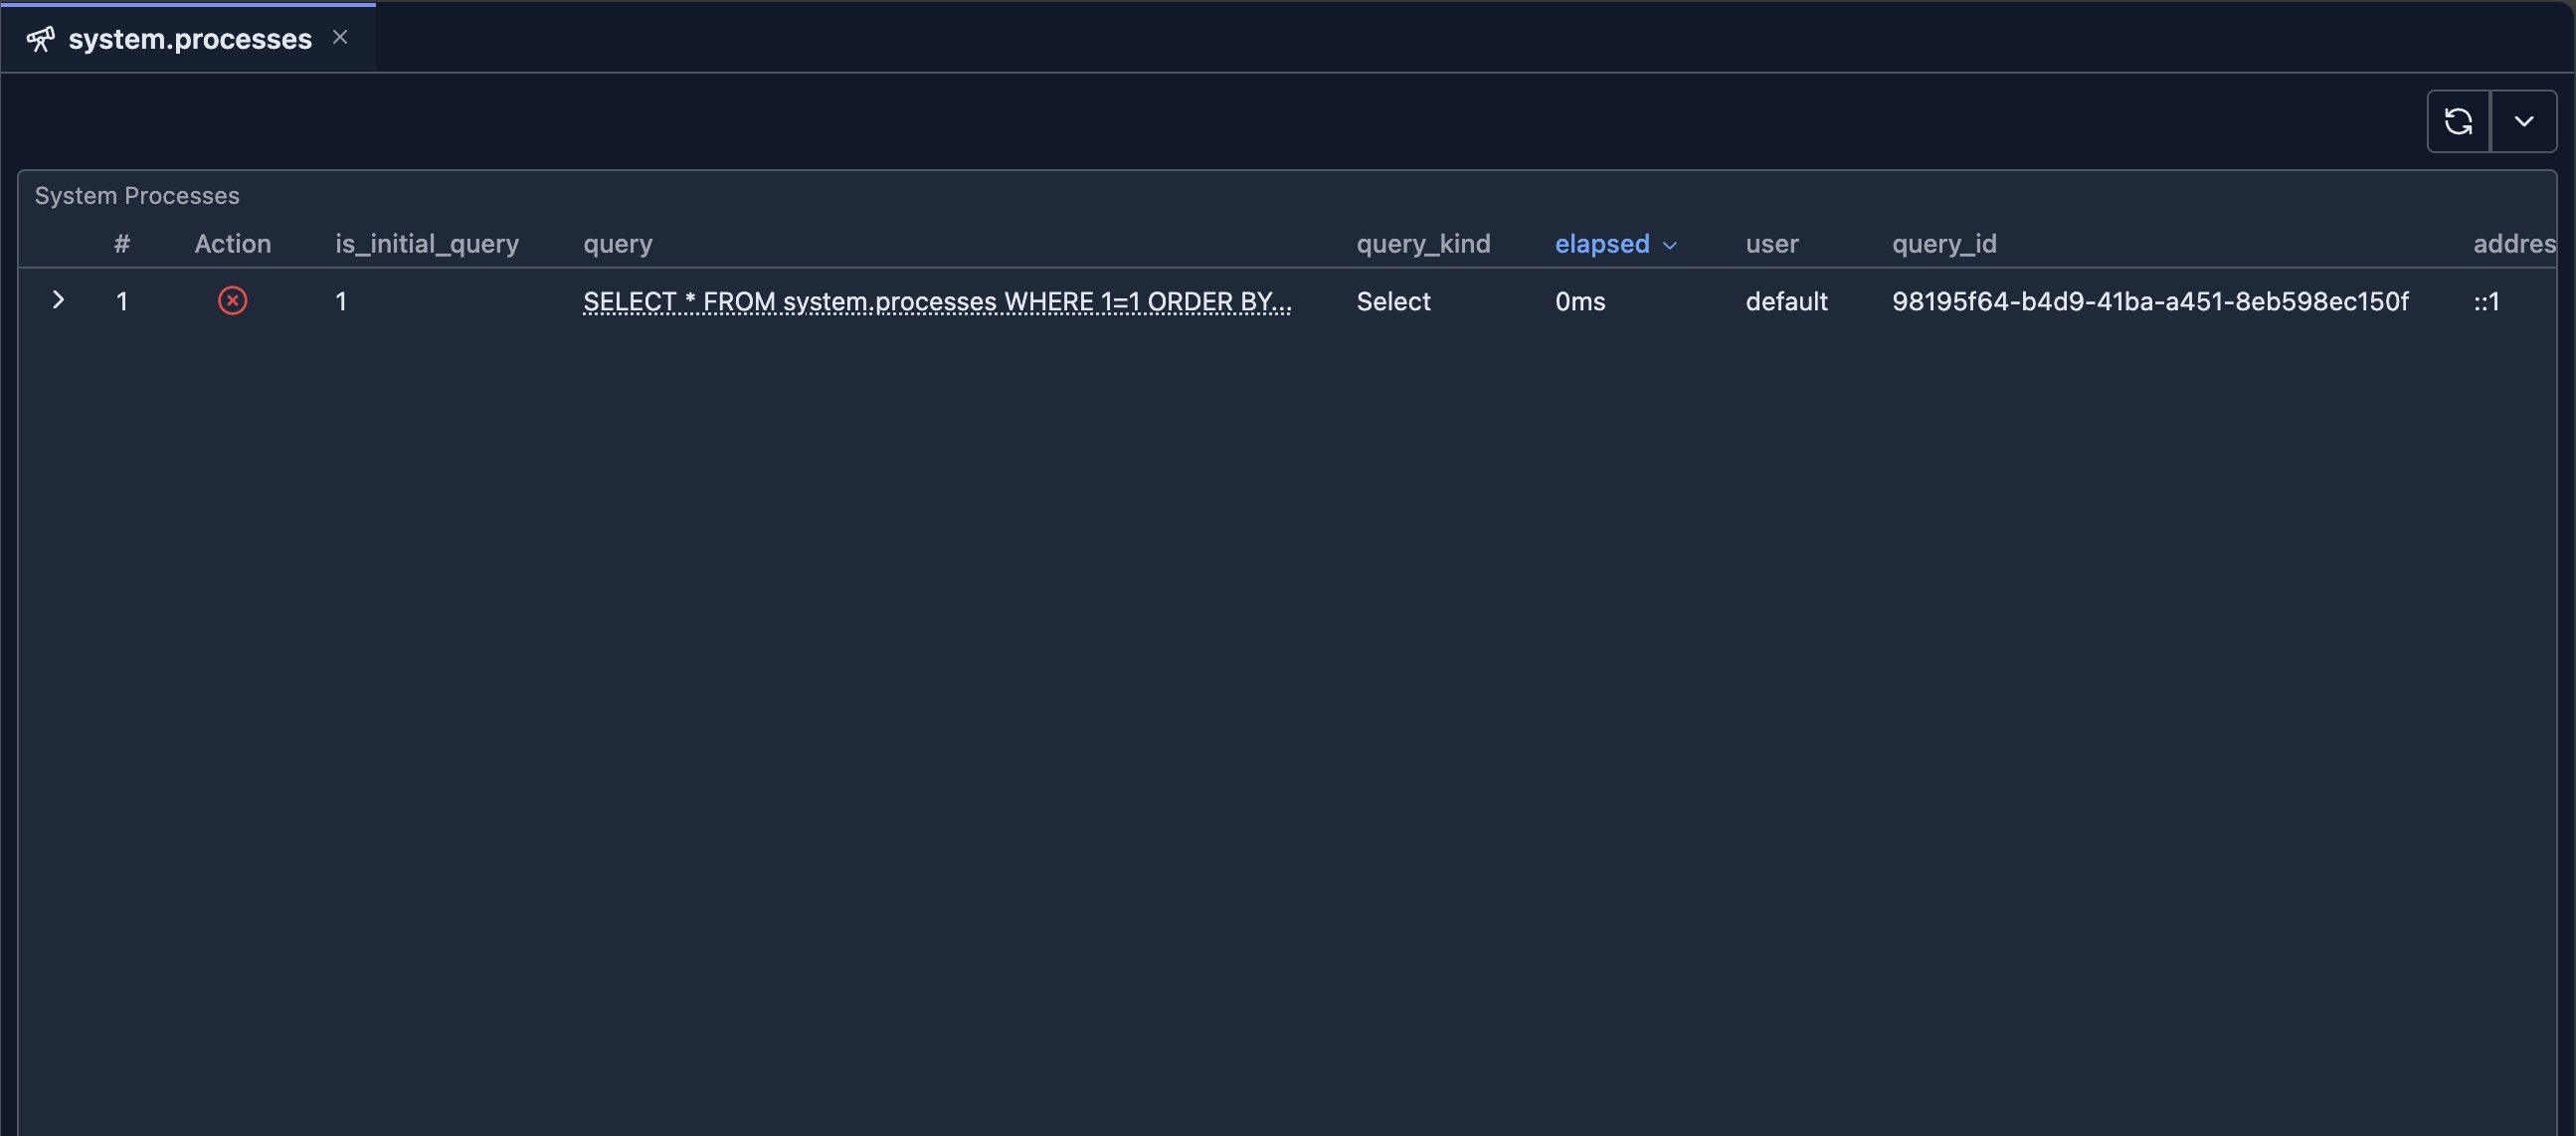
Features
Real-Time Process Monitoring
The tool displays all columns from the system.processes table, including:
- Query Information: Query ID, query text, and query start time
- User Information: User who initiated the query
- Resource Usage: Memory usage, read/written rows and bytes
- Execution Metrics: Query duration, elapsed time
- Connection Details: Client information, interface type
Kill Query Action
Each row includes an action column with a "Kill" button that allows you to terminate running queries:
- Click the Kill Button: Click the red "Kill" button in the Action column for the query you want to terminate
- Confirm Action: A confirmation dialog will appear asking you to confirm the kill operation
- Query Execution: Once confirmed, the system will execute:
KILL QUERY WHERE query_id = 'xxx'for single-node modeKILL QUERY WHERE query_id = 'xxx' ON CLUSTER 'cluster_name'for cluster mode
- Result Notification: You'll receive a success or error notification after the operation completes
Table Features
- Sorting: Click column headers to sort by any column (default: query_start_time descending)
- Pagination: Navigate through pages of results (100 rows per page)
- Row Details: Expand rows to see full query details in a transposed view
- Auto-Refresh: Use the refresh button to update the process list manually
- Compact Mode: View more information in a compact table layout
When to Use
Monitoring Long-Running Queries
- Identify Slow Queries: Sort by
query_duration_msto find queries that have been running for a long time - Monitor Resource Usage: Check
memory_usageto identify memory-intensive queries - Track Query Progress: Monitor
read_rowsandread_bytesto see query execution progress
Managing Problematic Queries
- Kill Hung Queries: Terminate queries that appear to be stuck or not responding
- Free Up Resources: Kill queries consuming excessive memory or CPU
- Emergency Termination: Quickly stop queries that are causing performance issues
Cluster Management
- View All Nodes: In cluster mode, see processes from all nodes in the cluster
- Kill Cluster-Wide: Terminate queries across the entire cluster when needed
- Monitor Cluster Load: Get an overview of all active queries across your cluster
Security Considerations
- Only users with
KILL QUERYprivileges can terminate queries - You can only kill queries that your user has permission to kill
- The kill operation is immediate and cannot be undone
- Always confirm before killing queries, especially in production environments
Next Steps
- system.query_log Introspection — Analyze completed queries and query history
- System Log Introspection — Overview of all system log tools
- Query Log Inspector — Analyze specific query execution details
- system.zookeeper Introspection — Browse ZooKeeper data