Database View
The Database View provides a comprehensive overview of a ClickHouse database, including statistics, table information, and dependency visualization. It serves as a central hub for understanding database structure, performance, and health, enabling efficient database monitoring and management.
Overview
The Database View combines multiple perspectives into a unified interface:
- Database Overview Tab: Statistics, metrics, and table information
- Database Dependency Tab: Visual graph of table dependencies within the database
Accessing the Database View
To access the Database View in ClickHouse Console:
- Navigate to Database: Click on a database name in the Schema Explorer sidebar
- Database Tab Opens: The Database View opens automatically in a new tab
- View Overview: The Database Overview tab is displayed by default, showing comprehensive database statistics and metrics
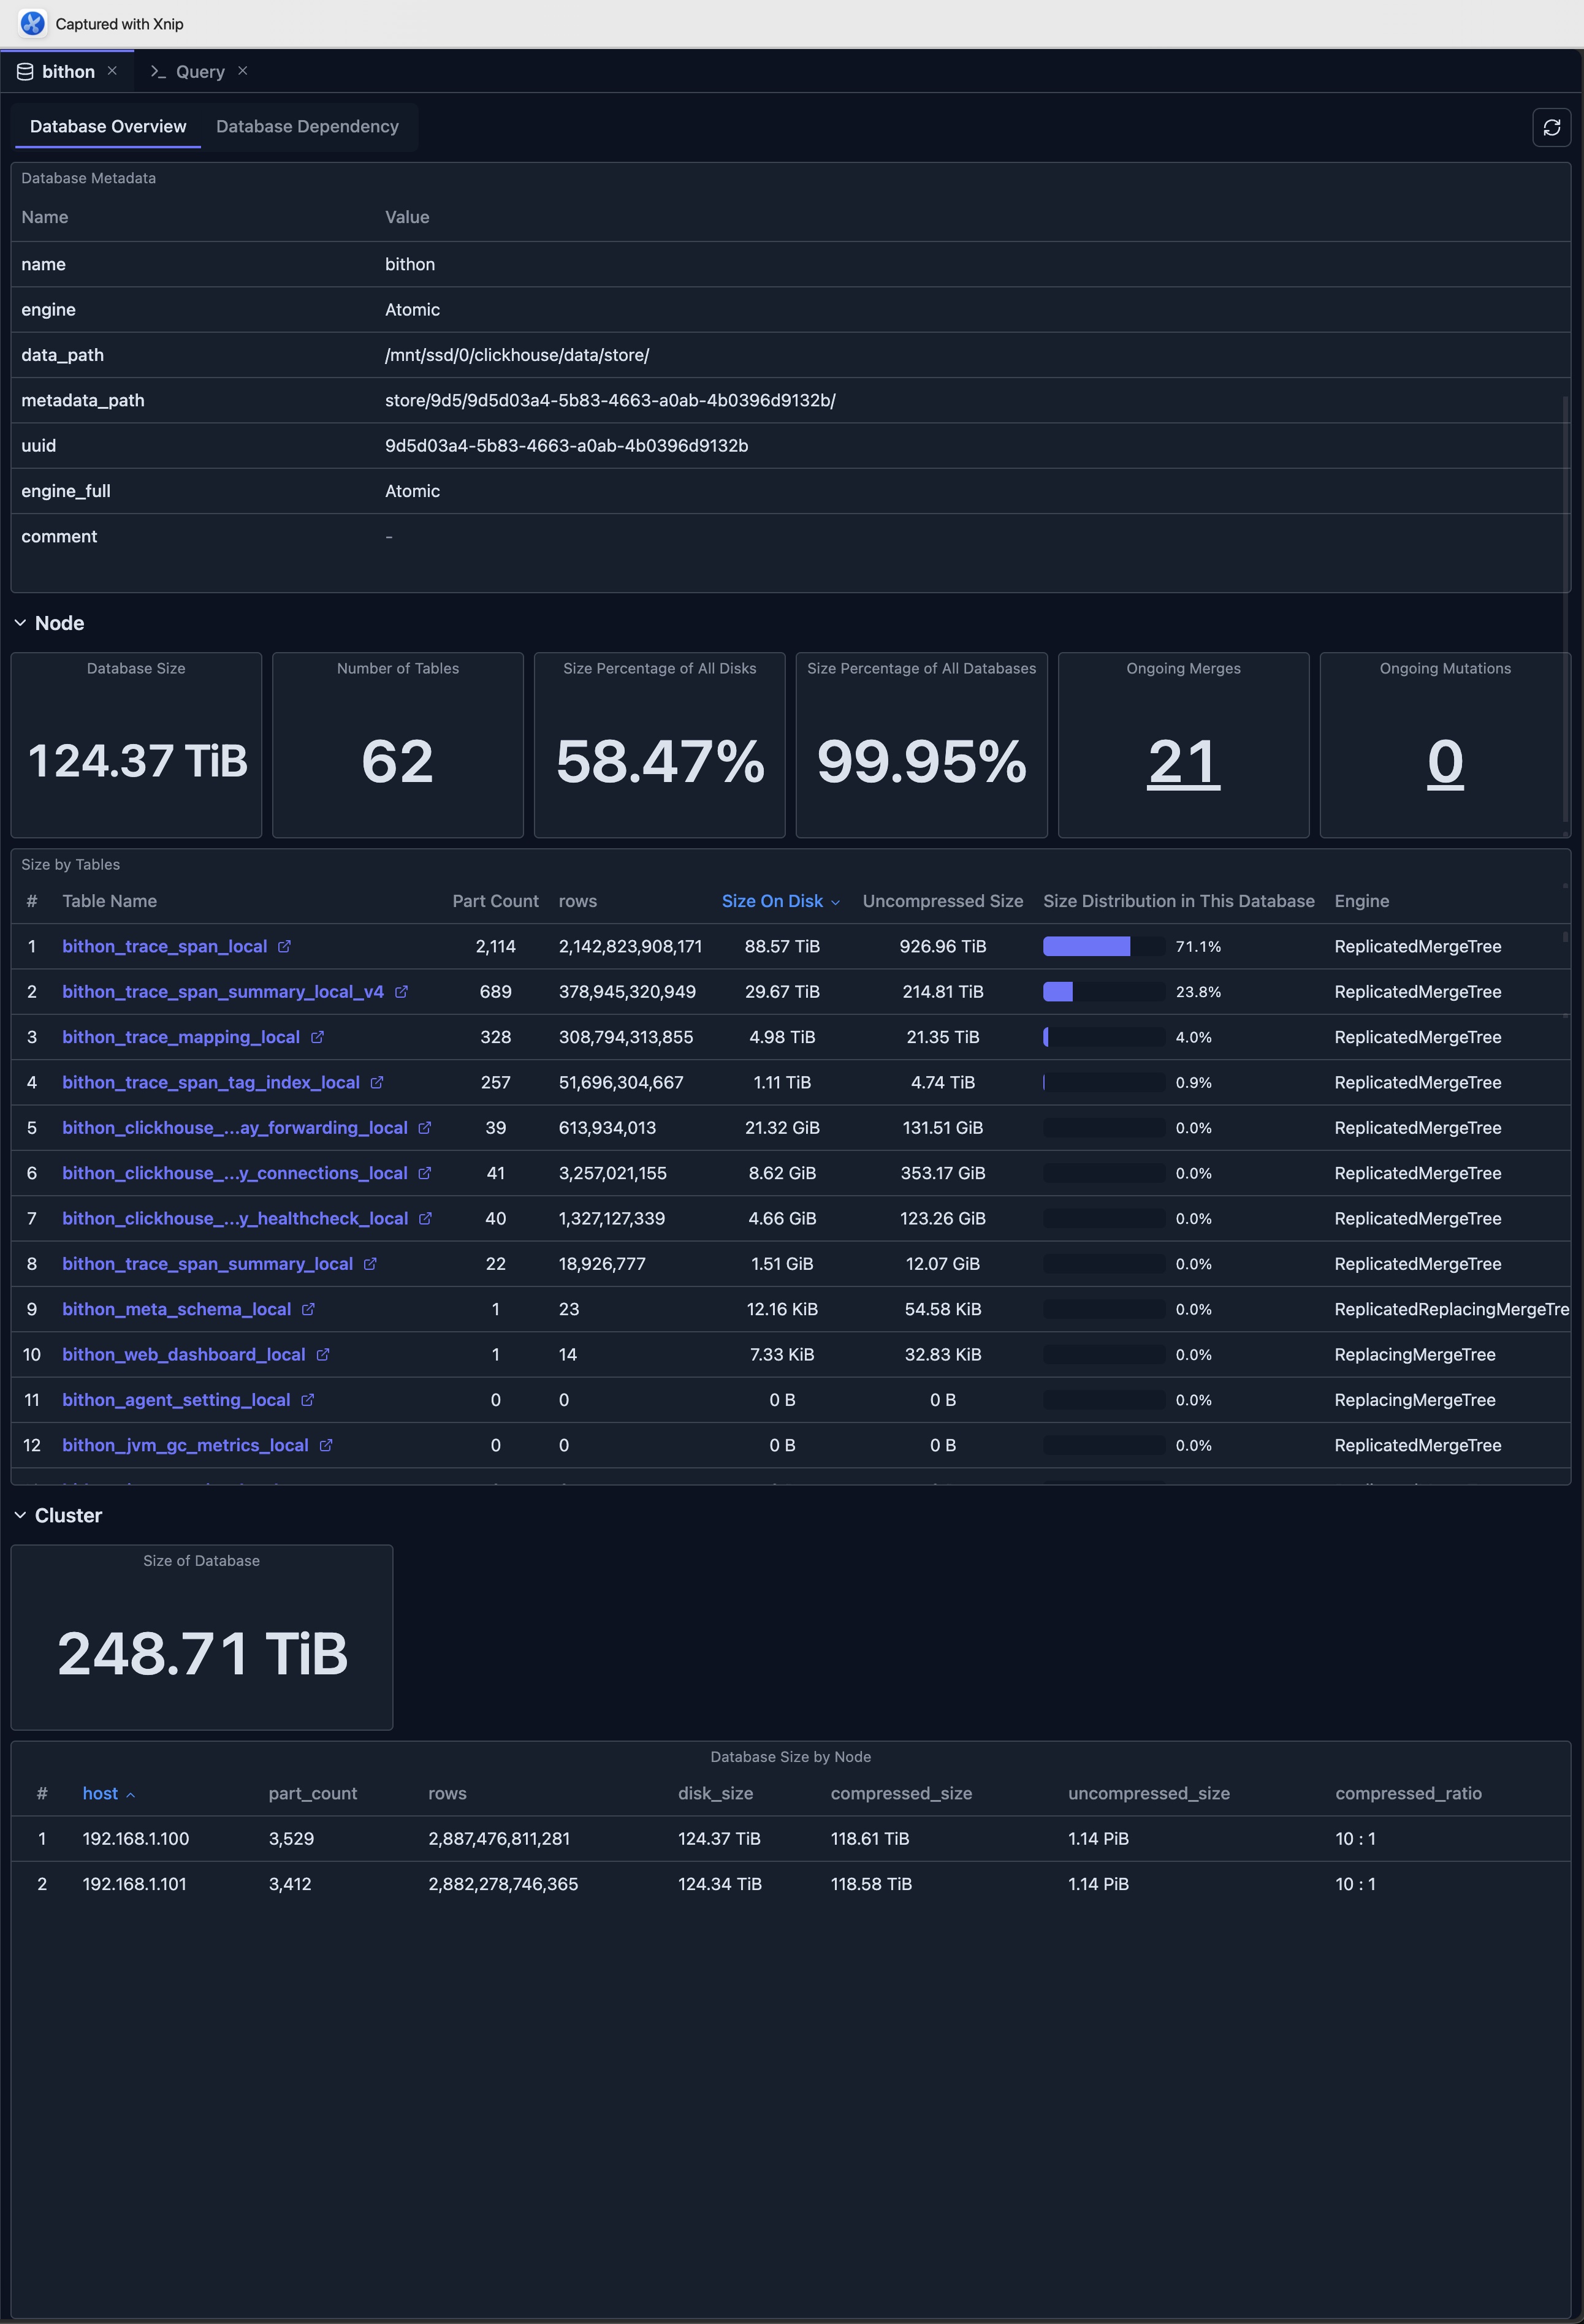
Database Overview Tab
The Database Overview tab provides comprehensive statistics and information about your ClickHouse database, enabling you to monitor database health, track performance metrics, and understand database structure at a glance.
Database Metadata
View essential database information:
- Database Name: The name of the database
- Engine Type: Database engine (if applicable)
- Metadata: All metadata fields from
system.databases
Key Statistics
The overview displays important metrics:
Database Size
- Total Size: Combined size of all tables in the database
- Size on Disk: Actual disk space used
- Uncompressed Size: Size before compression
- Size Percentage: Percentage of total disk space used
Table Information
- Number of Tables: Total count of tables in the database
- Table List: Detailed table information with:
- Table name
- Engine type
- Row count
- Size on disk
- Uncompressed size
- Size distribution percentage
- Part count
- Metadata modification time
- Data modification time
Size Distribution
- Size Percentage of All Disks: How much of total disk space this database uses
- Size Percentage of All Databases: How this database compares to others
- Table Size Distribution: Visual breakdown of size by table
Ongoing Operations
Monitor active database operations:
Ongoing Merges
- Merge Count: Number of active merge operations
- Merge Details: Click to see detailed merge information:
- Table name
- Result part name
- Number of parts being merged
- Elapsed time
- Progress percentage
- Memory usage
- Bytes read/written
- Rows read/written
Ongoing Mutations
- Mutation Count: Number of active mutation operations
- Mutation Details: Click to see detailed mutation information:
- Database and table
- Mutation ID
- Command being executed
- Parts remaining
- Failure information (if any)
Table Size Analysis
View detailed table size information:
- Sortable Table: Sort by size, row count, or modification time
- Quick Access: Click table names to open table details
- Size Visualization: See size distribution with percentage bars
- Engine Information: View table engine types
- Modification Times: Track when metadata and data were last modified
Cluster Mode Features
When connected to a cluster, additional metrics are available:
Cluster-wide Statistics
- Aggregate Database Size: Total size across all nodes
- Node Breakdown: Size distribution by node
- Compression Ratios: Compression statistics per node
- Part Counts: Part distribution across cluster
Node Comparison
Compare database size and statistics across cluster nodes:
- Hostname: Each node in the cluster
- Part Count: Number of parts per node
- Row Count: Total rows per node
- Disk Size: Size on disk per node
- Compressed/Uncompressed Size: Storage metrics
- Compression Ratio: Compression efficiency
Database Dependency Tab
The Database Dependency tab shows a visual graph of all table dependencies within the database. This is a powerful tool for understanding the relationships between your tables, tracking data lineage, and identifying dependencies for materialized views and other database objects.
Features
- Complete Dependency Graph: All tables and their relationships, including:
- Distributed tables and their local tables
- Source and targets of Materialized Views
- Dictionary
- MySQL table engine and MySQL server
- Kafka table and Kafka server
- Interactive Navigation: Click nodes to view table details
- Upstream/Downstream View: See dependency directions
- Table Details Panel: View table DDL statements and metadata
For detailed information about the dependency view, see Dependency View.
Limitations
When using the Database View, be aware of the following limitations:
- System Table Access: Requires read access to ClickHouse system tables (
system.databases,system.tables,system.parts, etc.) - Data Retention: Metrics depend on ClickHouse's system tables retention policies and may not show historical data beyond the retention period
- Performance Impact: Querying large databases with many tables may be slow, especially when loading comprehensive statistics
- Real-time Accuracy: Some metrics may have slight delays as they are based on system table snapshots rather than real-time data
- Version Compatibility: Some features may not be available in older ClickHouse versions, as they depend on specific system table columns and functionality
Best Practices
Regular Monitoring
- Schedule Reviews: Regularly review database statistics
- Track Trends: Monitor size and operation trends over time
- Set Alerts: Use metrics to identify issues early
Performance Optimization
- Identify Large Tables: Focus optimization on large tables
- Monitor Operations: Track merge and mutation performance
- Balance Resources: Use cluster metrics to balance load
Maintenance Planning
- Plan Maintenance: Use statistics to plan maintenance windows
- Track Changes: Monitor modification times for change tracking
- Optimize Storage: Use size information for storage optimization
Integration with Other Features
- Schema Explorer: Navigate to specific tables from the overview
- Table View: Open detailed table views from the table list
- Dependency View: Access dependency visualization from the dependency tab
- Cluster Dashboard: Compare with cluster-wide metrics
- Query Editor: Use database information when writing queries
Next Steps
- Dependency View — Explore table dependencies and relationships
- Table View — View detailed table information
- Cluster Dashboard — Monitor cluster-wide metrics
- Node Dashboard — View individual node performance
- Schema Explorer — Navigate database structure