Cluster Dashboard
The Cluster Dashboard provides a high-level overview of your entire ClickHouse cluster, showing aggregate metrics across all nodes.
Overview
The Cluster Dashboard is a pre-configured monitoring view that requires no setup. It automatically:
- Aggregates Metrics: Collects data from ClickHouse system tables across all nodes
- Visualizes Performance: Displays metrics as charts, gauges, and tables
- Supports Filtering: Allows you to filter by time range, hostname, and other dimensions
- Provides Drill-downs: Click on metrics to see detailed breakdowns
- Updates in Real-time: Refreshes automatically or manually to see latest data
Prerequisite
Your database connection must be configured as cluster.
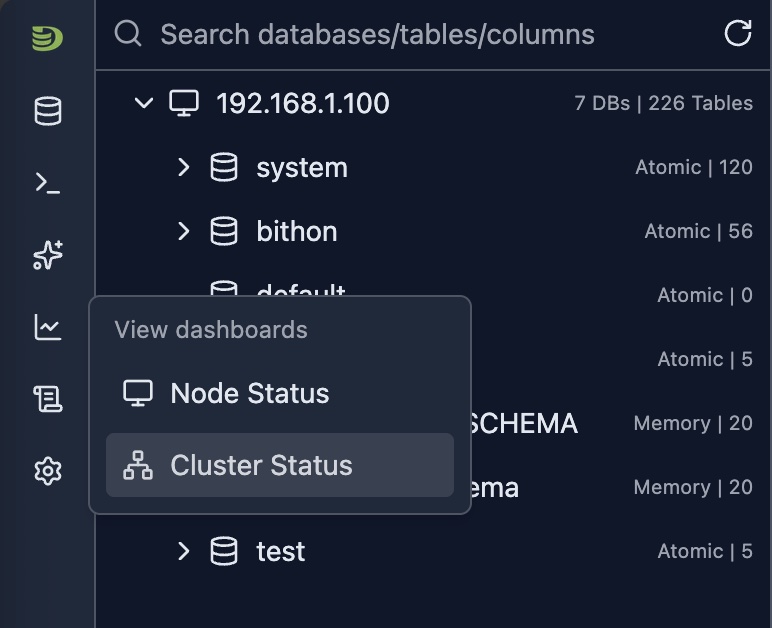
Opening the Cluster Dashboard
- Open Cluster Tab: Click on the cluster name in the sidebar or navigate to the cluster view
- View Dashboard: The cluster dashboard displays automatically
Cluster Dashboard Overview
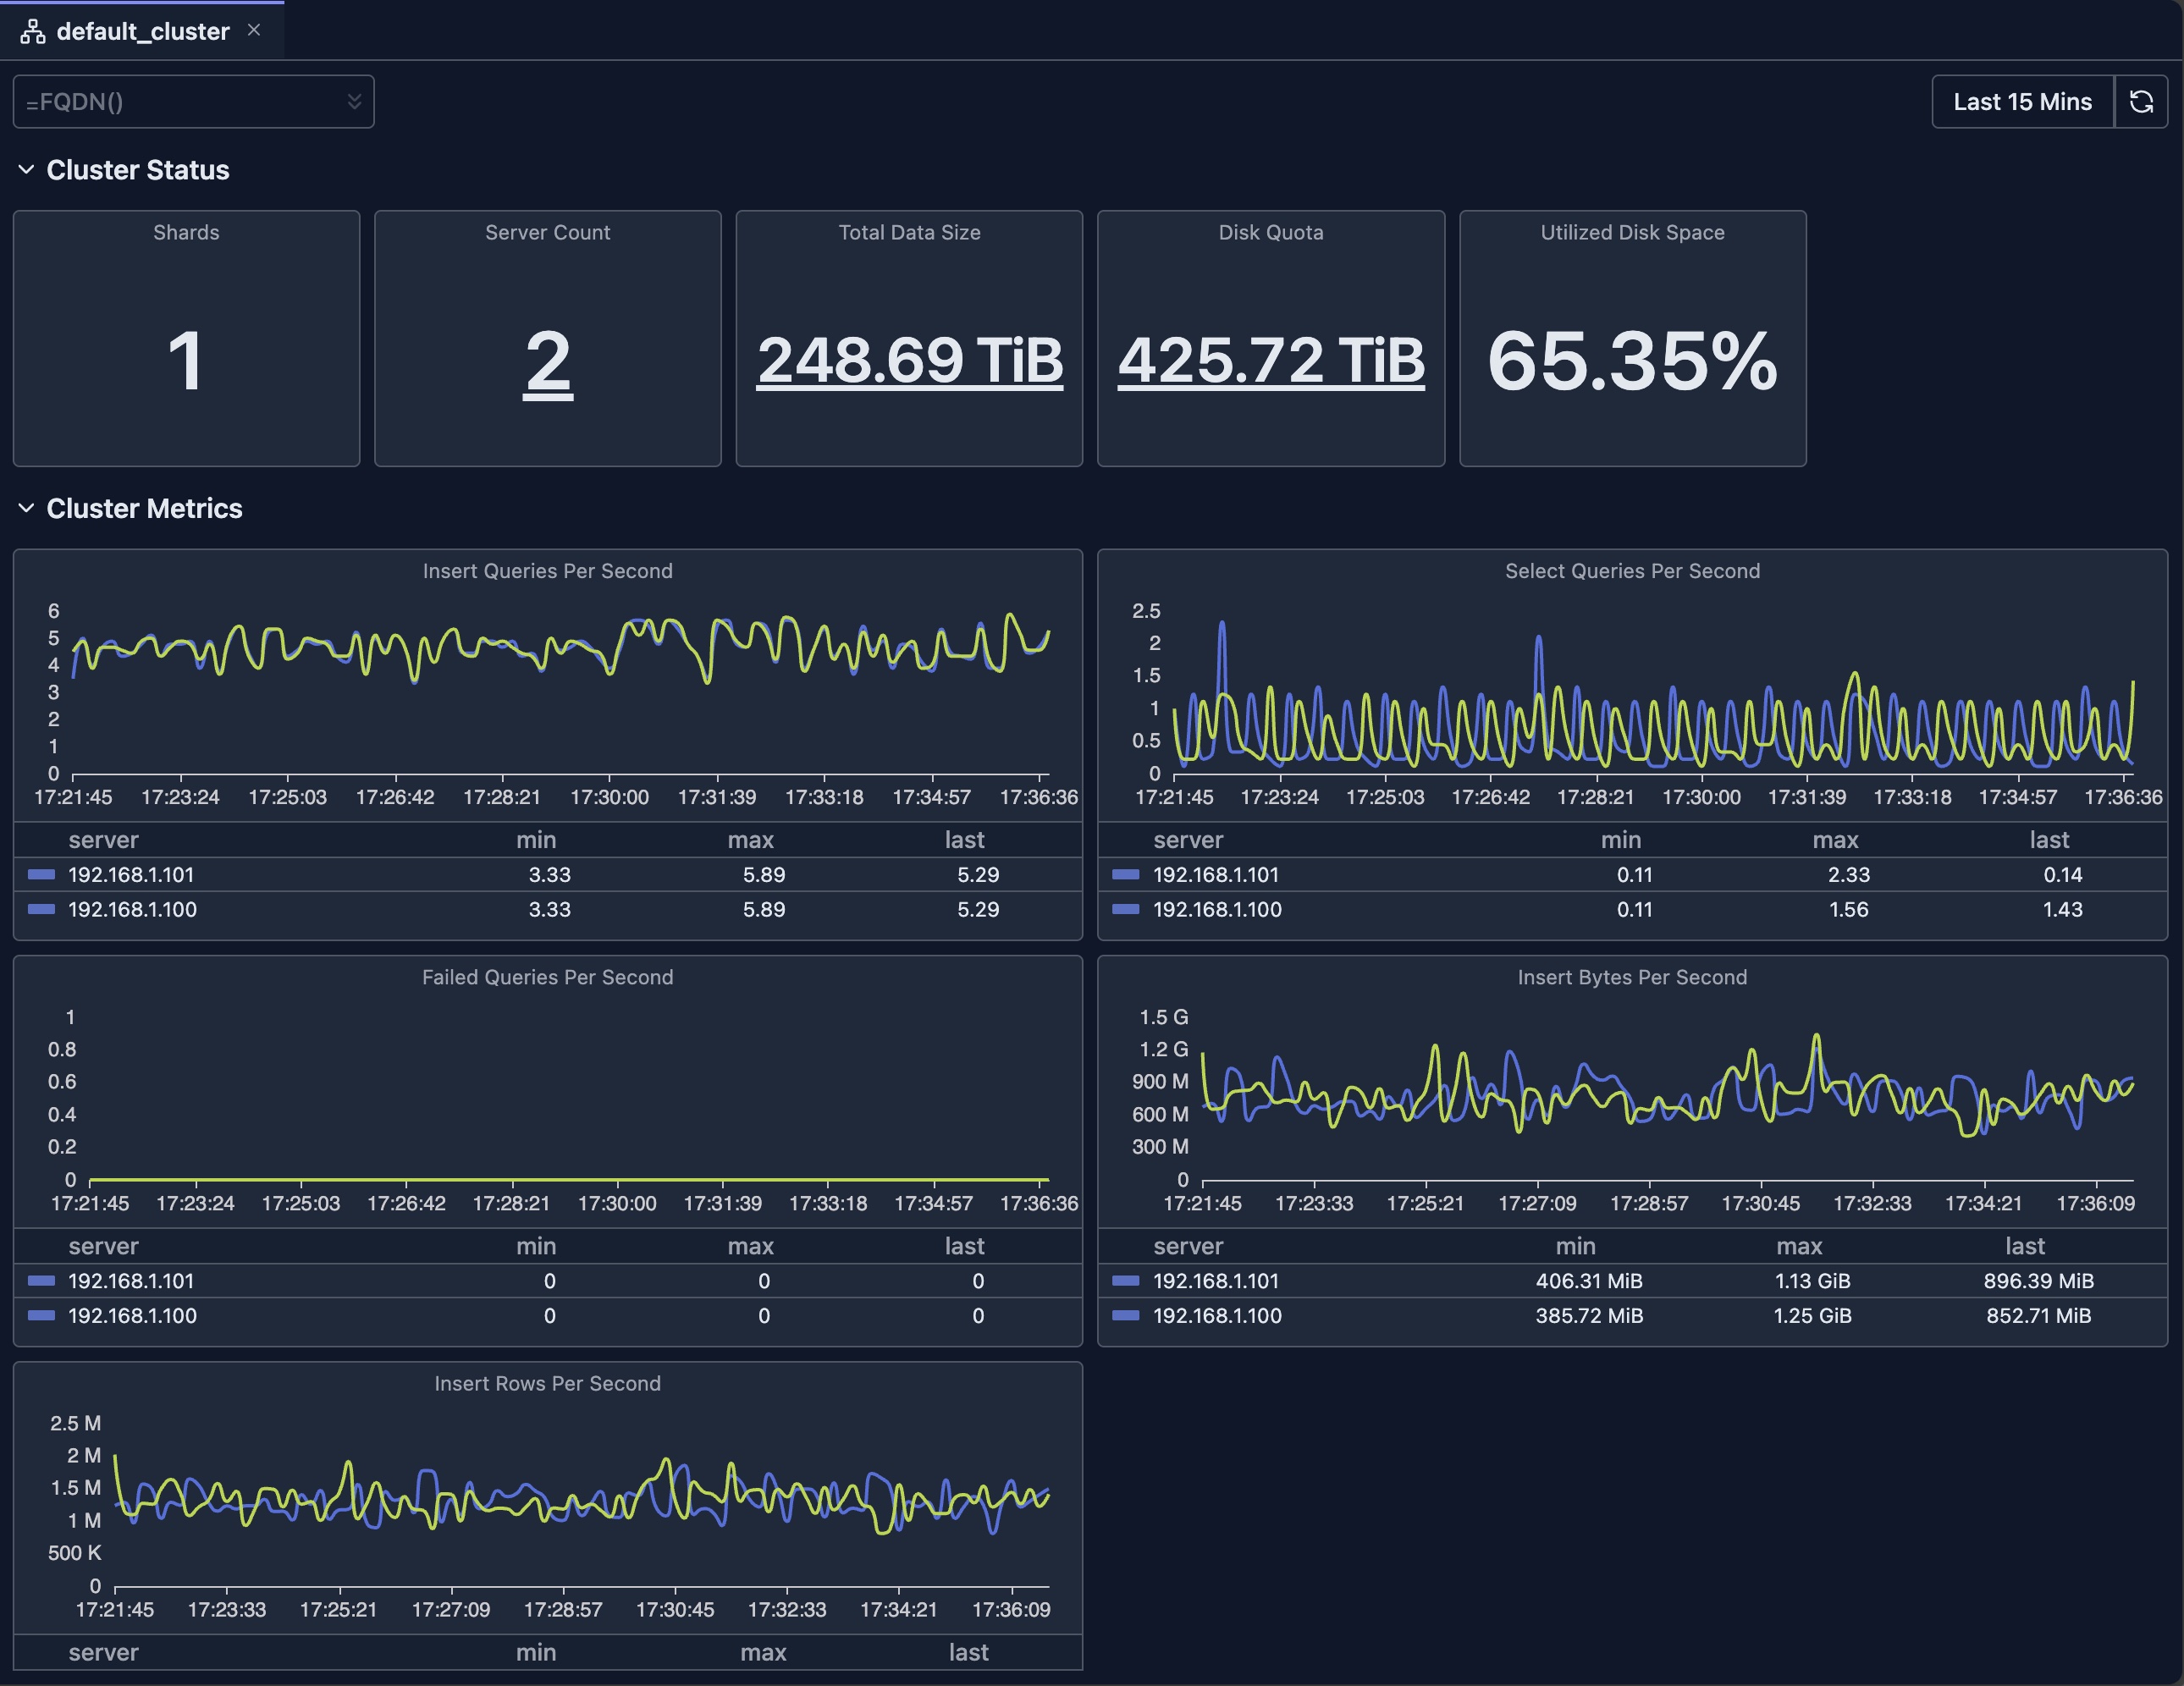
Dashboard Features
Time Range Selection
The dashboard supports flexible time range selection:
- Predefined Ranges: Last 15 minutes, Last hour, Today, This week, etc.
- Custom Range: Select specific start and end times
- Auto-refresh: Automatically refresh data at intervals (where supported)
Filtering
- Hostname Filter: Filter by specific nodes
Chart Types
The dashboard uses various visualization types:
- Stat Cards: Single-value metrics with drill-downs
- Line Charts: Time-series data with multiple series
- Bar Charts: Distribution and comparison data
- Gauges: Percentage and threshold indicators
- Tables: Detailed data with sorting and pagination
Drill-downs
Many metrics support drill-down functionality to view the breakdown of original metric.
Refresh and Auto-refresh
- Manual Refresh: Click the refresh button to update data
- Auto-refresh: Enable automatic updates (where supported)
Limitations
- System Table Access: Requires read access to ClickHouse system tables
- Data Retention: Metrics depend on ClickHouse's system tables retention settings
- Availability: Requires your ClickHouse nodes to be available
- Version Compatibility: Some metrics may not be available in older ClickHouse versions
- Performance Impact: Querying large time ranges may be slow and consumes resources of your ClickHouse cluster
Deep dive: Explore System Log Introspection for detailed analysis of system tables.
Next Steps
- Node Dashboard — View detailed metrics for individual nodes
- Query Log Inspector — Analyze specific query performance
- Schema Explorer — Explore your database structure
- System Log Introspection — Deep dive into query and part logs